Which body composition tracking app imports DEXA scans

You walk out of the clinic with a PDF. Three pages, a whole-body table, a regional breakdown, and one number you think about for the rest of the day. Then it sits in your email.
Search “body composition tracking app” and you find ranked lists of tools that estimate metrics from a photo or a smart scale. DEXA appears in every list as the benchmark those estimates are measured against. None of them answer the question you have at 9 am the morning after a scan: I have the report, now what? That question, and the wider picture of how RESISTX compares to other trackers, is what this post covers.
What does a body composition tracking app do with a DEXA scan?
Most body composition tracking apps do nothing with a DEXA scan. They generate an estimate from a photo, a smart scale or a tape measure, and treat DEXA as a reference standard to validate themselves against rather than data you can hand them.
Body-composition data enters an app in three ways. The app takes the measurement itself, which is the model behind 3D-scan and photo products. A partnered clinic sends the scan electronically. Or the app reads the report you already have. Training apps mostly sit under all three: Hevy’s body measurement help doc describes weight to 0.1 kg, a typed body-fat percentage and a list of circumferences, with no scan input.
RESISTX takes the third route. It imports the DEXA report PDF, keeps the regional lean and fat figures, extracts the historical scans embedded in the report, and holds every value traceable back to its source page.
Which apps can import a DEXA scan, and how does the data get in?
Only a small number of consumer apps take DEXA data at all. The difference between them is who does the work: your clinic, you, or the software. FitTrace receives scans by electronic transfer from participating DEXA facilities or asks you to type the numbers from the printout, and RESISTX imports the report PDF from any provider.
App Store listing in FitTrace is explicit about the first route: “Your scans are electronically transferred to you via FitTrace with participating DEXA facilities.” When your clinic participates, that beats any import, because there is nothing to import. The listing gives manual entry from printouts as the fallback, states tracking of “over two hundred DEXA-related variables”, and pushes weight, body fat percentage, lean mass and BMI to Apple Health. A PDF upload path is not stated on the listing.
| How the scan gets in | Any provider | What survives | |
|---|---|---|---|
| FitTrace | Electronic transfer from participating facilities, or typed from the printout | Participating facilities; PDF upload not stated | Body fat, muscle mass, visceral fat, over 200 DEXA-related variables |
| RESISTX | PDF import of the report itself | Any provider that hands you a report | Regional lean and fat, scans embedded in the report, source traceability |
| Photo and 3D-scan apps | No DEXA input; the app makes its own measurement | Not applicable | Their own measurement over time |
| Training apps with a measurements tab | Manual entry only | Not applicable | Whatever you typed |
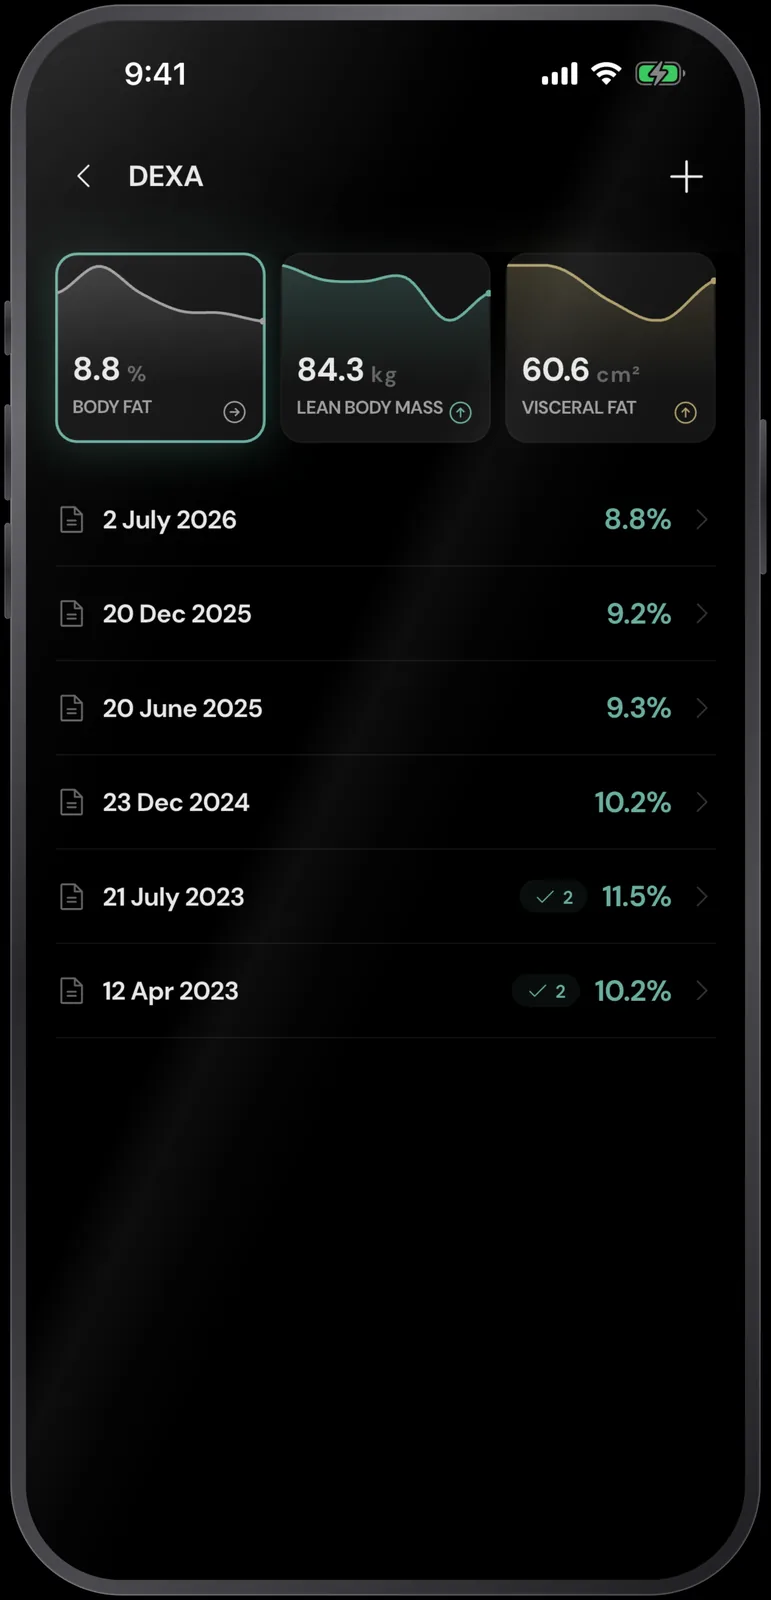
Two of those six entries carry 2 embedded historical scans, so a list of six PDFs holds more history than the file count suggests.
How accurate is a DEXA scan, and how much change is real?
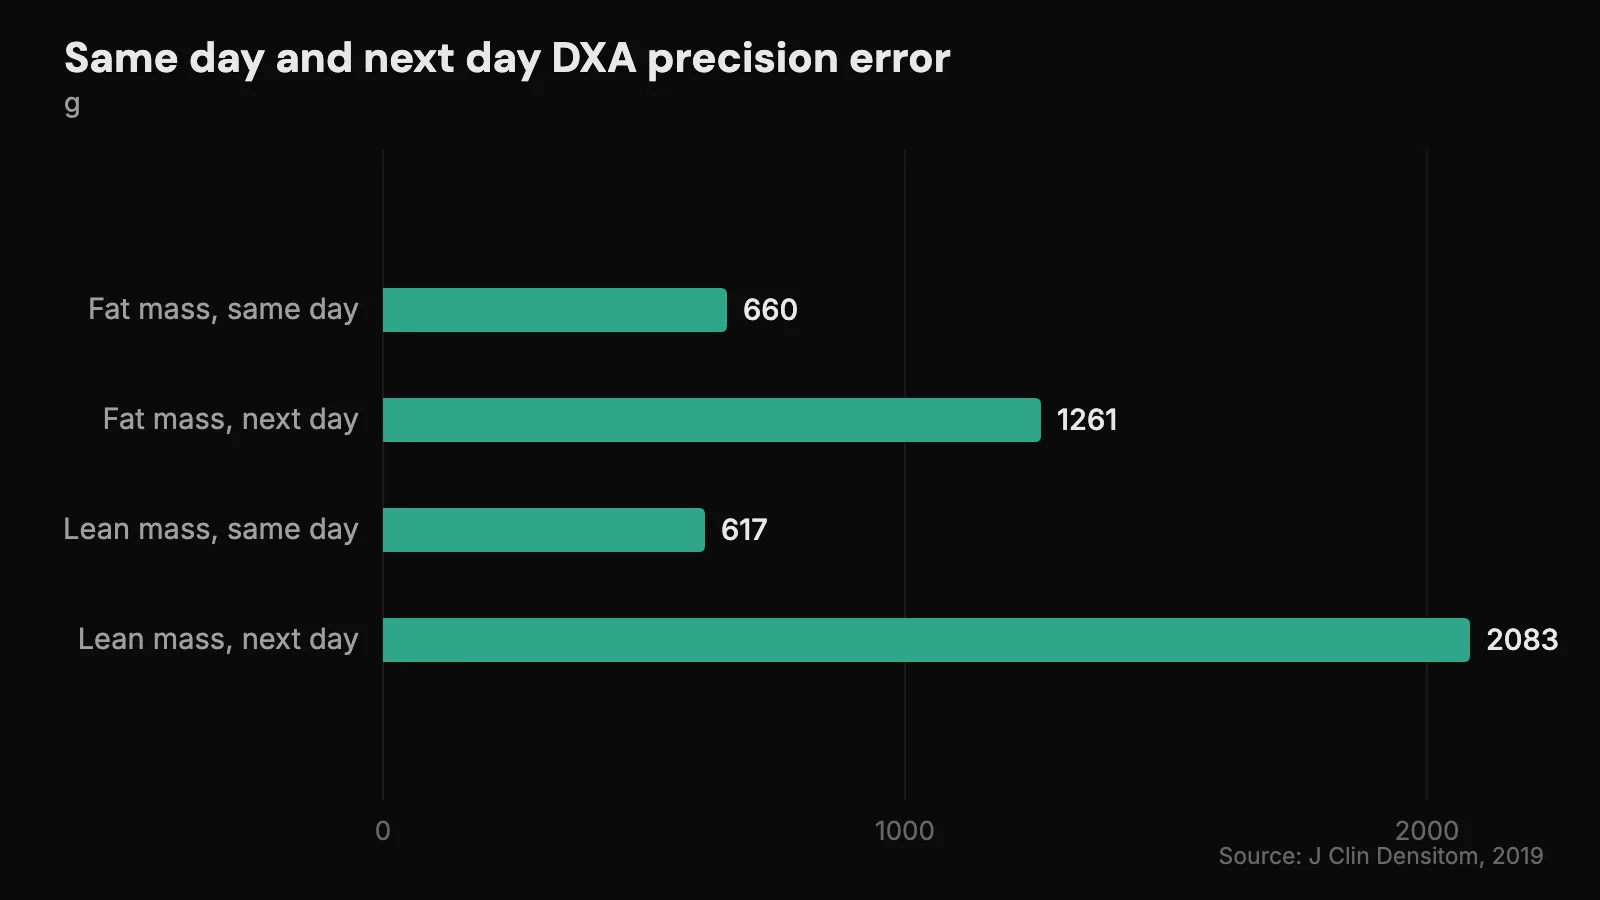
DEXA is the practical reference standard for body composition, but its precision error is larger than most lifters assume. In 21 resistance-trained athletes, consecutive-day precision error was 1261 g for fat mass and 2083 g for lean mass, against 660 g and 617 g when the two scans were taken back to back on the same day (J Clin Densitom, 2019).
Look at the lean-mass pair again. Same person, same machine, one day apart, and the error more than tripled. A 2 kg lean-mass gain between two casually prepped scans can be gut contents and glycogen.
Prep is the lever you control. When 20 recreationally active subjects replicated the previous 24 hours of food, fluid and activity before both scans, the day-to-day penalty vanished: 479 g against 626 g for fat mass, 634 g against 734 g for lean mass, with no significant difference (IJSNEM, 2023). The error bars for calipers, InBody and the tape sit next to DEXA’s in the post on least significant change on DEXA.
Can you compare a DEXA scan from one clinic to another?
Not directly, because the two machines disagree in a consistent direction. Across 926 postmenopausal women, a GE Lunar iDXA read body fat 1.1 percentage points higher and total lean mass about 1.3 kg lower than a Hologic Horizon A.
Both gaps were statistically significant, at p = .001 and p < .001. Total fat mass was not, at 802 g and p = .19. The two numbers that moved are the two a lifter reads first on the report. Change hardware and you can manufacture a recomposition that never happened.
The same thing happens with cheaper instruments. My coach was pinching me in the mid 40s of total millimetres when I stopped seeing him, and as soon as my husband started doing my pinches the numbers jumped to the low 60s. Same body, new measurer, new baseline. “Again the number is kind of irrelevant, it’s all about the direction.” Since early November 2025 that total has gone from 64.3 mm to 61.5 mm, which is the part I care about.
An imported scan should carry its source with it. The detail sheet for 2 July 2026 says MeasureUp, Hologic, 96.3 kg, so a future scan on a Lunar machine reads as a new baseline instead of a silent step in the trend.
Should you read the regional breakdown on your report?
Read the regional breakdown for shape, not for verdicts. Regional least significant change is worse than whole-body: in 60 Division 1 athletes, LSC varied by region, tissue type, sex and body size (J Clin Densitom, 2014), and in the trained-athlete precision data scan-to-scan agreement was lower regionally, R² = 0.95 to 0.99, than for whole-body measures at R² = 0.98 to 1.00.
Smaller regions are the least trustworthy, because LSC as a percentage of mass climbs as the region shrinks. An arm holds a few kilos of tissue. A 200 g left-to-right difference in one isn’t an imbalance finding.
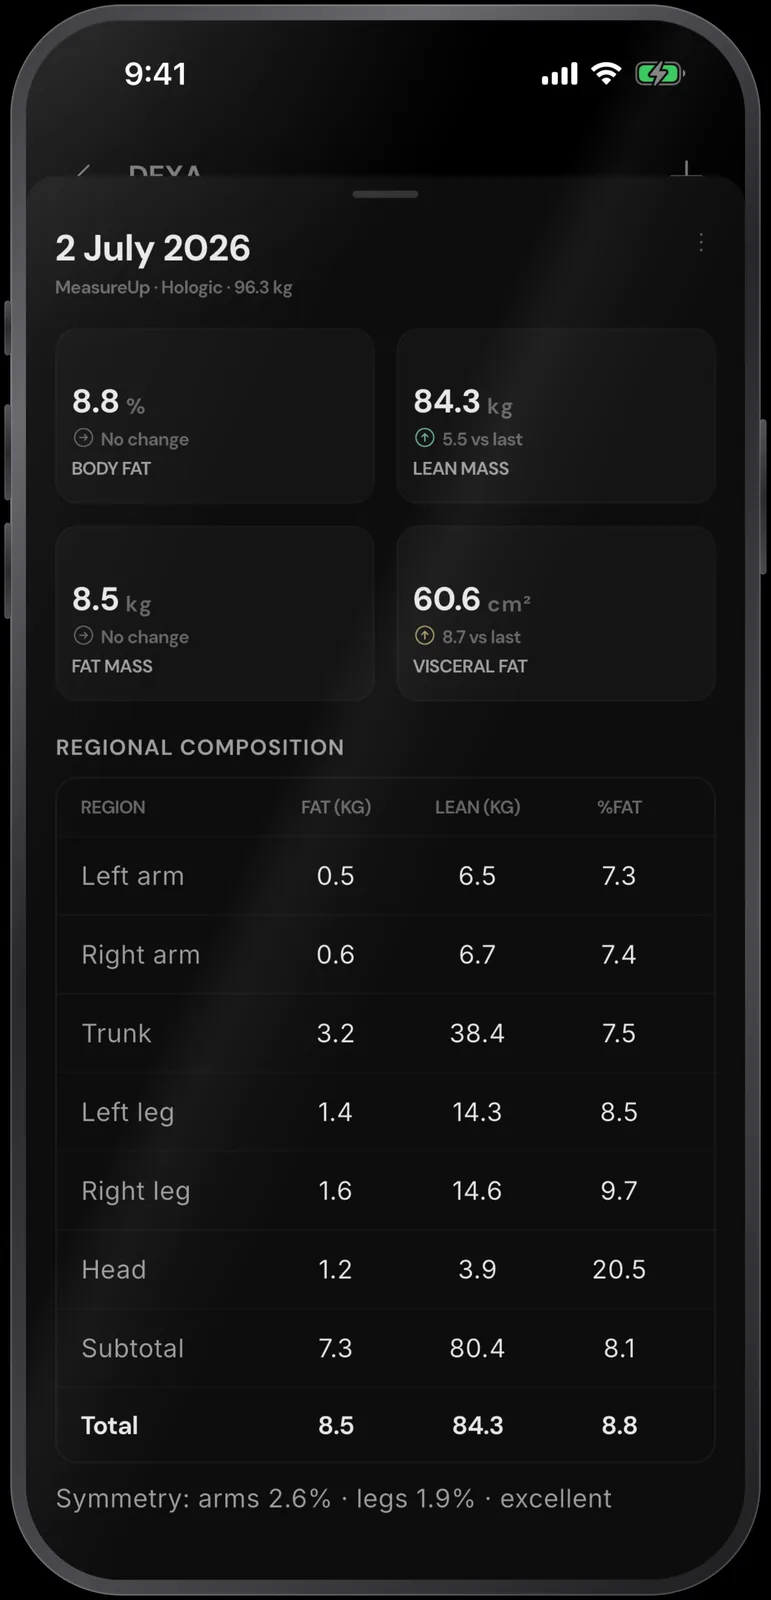
That sheet reads arms 2.6% and legs 1.9% for symmetry. Watch it across the next 3 scans. It isn’t worth changing a program over on its own. Whole-body numbers on the same scan have the tighter band: lean mass 84.3 kg, up 5.5 kg on the previous scan, comfortably clear of a 2083 g noise floor that a 500 g move would sit inside.
How do you use one scan to make weekly tracking more accurate?
A DEXA scan is most useful for anchoring the cheap methods you run every week. Skinfolds and BIA read systematically low against DEXA rather than scattering evenly around it: in 76 male football players, DEXA said 19.0% body fat, skinfolds said 12.7% and BIA said 9.3%. In 70 female players the spread was wider, at 29.2%, 17.8% and 14.9%.
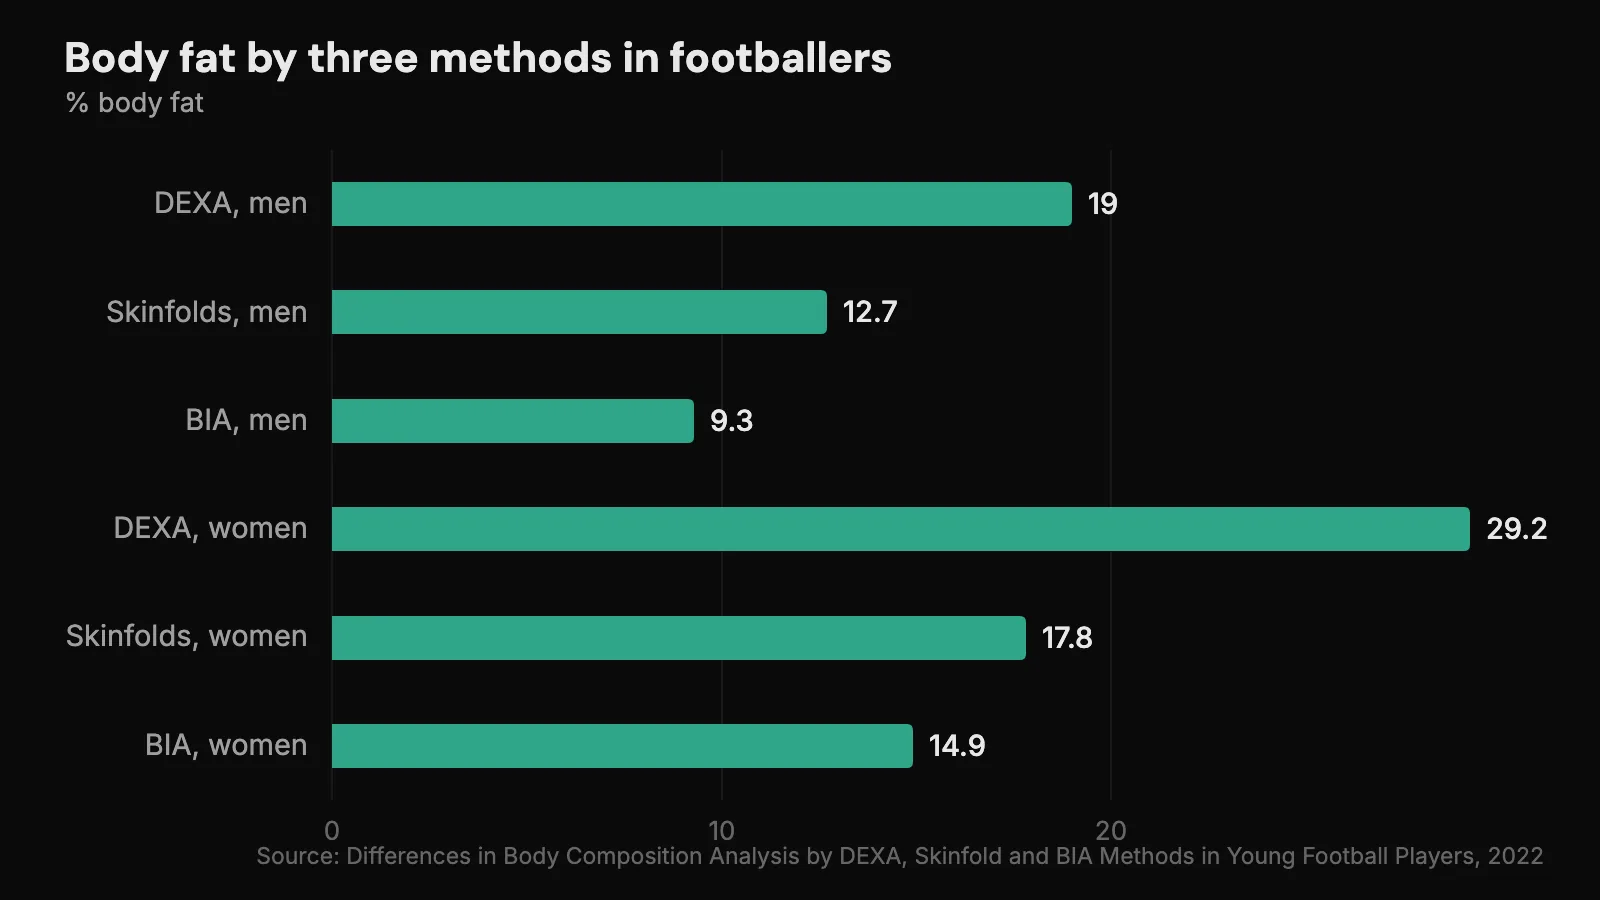
The correlations behind those gaps are strong, R = 0.909 for skinfolds and R = 0.877 for BIA, which is the statistical case for correcting a weekly method against a scan instead of binning it. RESISTX does that with body-fat fusion: DEXA, skinfold and BIA estimates combined and weighted by method reliability, with the scans calibrating the cheaper inputs.
Photo-based estimates carry roughly 4 to 5 percentage points of absolute error for an individual. This error is wider than the change most lifters try to detect across a mesocycle. Between scans, the useful instruments are the filtered weight trend described in trend weight vs scale weight, plus circumferences and progress photos shot in the same light, at the same time of day, on the same day of the week.
How often should you get a DEXA scan?
Radiation isn’t the constraint. A whole-body composition scan is roughly 4 to 5 µSv according to BodySpec, a scanning clinic, against about 35 µSv for a New York to Los Angeles flight, so frequency is governed by measurement noise rather than dose.
Composition ID puts the practical interval at every 4 to 5 weeks for coached clients, and every 2 to 4 weeks for aggressive goals, on the reasoning that the body needs about 4 weeks to show measurable change. Both are clinic sources, not peer reviewed. Put them next to the precision numbers and the longer end wins: if consecutive-day lean-mass error is 2083 g, a fortnightly scan is mostly measuring its own error.
Get a baseline, then rescan at the end of a training phase. Use the same machine, same clinic, and same time of day, with the 24 hours before it replicated as closely as you can manage. If that phase was a cut, the end of it is also the sensible moment to check what a cut does to testosterone, since the composition change and the hormonal cost show up on the same timeline.
Questions people ask
Can I import my DEXA scan PDF into an app?
Very few apps do it. FitTrace’s listing describes electronic transfer from participating DEXA facilities or manual typing from the printout, with no PDF upload path stated. RESISTX imports the report PDF from any provider and keeps the regional lean and fat figures, the historical scans embedded in the report, and traceability to the source page. The mainstream body-composition apps ranking on page one accept no DEXA data at all.
How accurate is a DEXA scan for body fat percentage?
The useful answer is about detecting change, not a single accuracy figure. In 21 resistance-trained athletes, consecutive-day precision error was 1261 g for fat mass and 2083 g for lean mass, against 660 g and 617 g same-day. Standardising the 24 hours before each scan brought consecutive-day error down to 479 g fat and 634 g lean, with no significant difference from same-day scanning.
Why did my body fat percentage change when I switched clinics?
The machines differ. Across 926 postmenopausal women, a GE Lunar iDXA read body fat 1.1 percentage points higher and lean mass about 1.3 kg lower than a Hologic Horizon A, both statistically significant. Stay on one machine where you can, and treat a switch as a new baseline rather than a data point in the old trend. Per-scan source traceability in RESISTX makes that switch visible instead of invisible.
Is a smart scale or a photo estimate good enough instead of DEXA?
No, not for a single absolute number. BIA and skinfolds read systematically low against DEXA, at 9.3% and 12.7% against 19.0% in male athletes, and single-photo estimates carry roughly 4 to 5 percentage points of absolute error. They are fine for tracking direction between scans, and they get better once anchored. Calibrate them against your most recent scan and read the direction.